The S curve is a simple concept that illustrates natural phenomena – and thus is helpful in modeling, planning, and tracking in many applications. This post explores how it can be helpful in project planning, status reporting, project portfolio management (PPM), and in developing company strategy and tracking toward strategic goals.
The S curve is a generalized description of the shape – it looks like and S – of the curve on a graph, where there is a slow start (flat lower part of the S), followed by an accelerated growth period (the middle of the S that is heads steeply upward), and a slow or stable period (flat top of the S).
The S Curve in Project Management
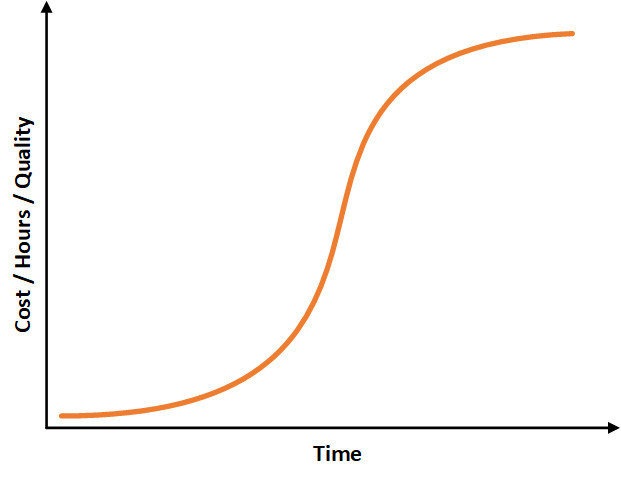
In project management, the s curve can help to forecast costs, the needs for resources, and the progressive achievement of the desired quality level over time. In the same manner, it can be used to track the status of those same metrics over time as the project is implemented. The chart shows the s shape – flat at first, then steeply rising, then flat again.
As the s curve graphically demonstrates natural phenomena, it is natural that on a project, a minimal cost will be accrued in the very beginning of the project. Then, as the project implementation accelerates, costs are accrued more rapidly. Finally, toward the end of the project, the s curve flattens as costs again decelerate.
The same phenomena happen for the burning of resource hours, as well as the achievement of the target quality product. There is always an initial flat but slowly accelerating time segment, a growth segment that is rapidly accelerating segment, a growth segment that begins to slowly decelerate, and finally a flat and still decelerating segment, resulting in the s shape depicted in the graph.
The S Curve and Industry Development
Even industry development can be depicted by an s curve. Industries develop at different paces. Some can last for a very long time, and others a very short life span. Changes come to industries at different times in their existence and with much different effects.
Just as the s curve applies to the unfolding of a project, it applies to the unfolding of an industry – from birth, to growth, and finally to stability and decline. At first, the industry slowly becomes established and takes hold, gradually gaining momentum. Then in the middle of the s curve, at its peak of growth, it reaches an inflection point and gradually begins to decelerate. In time, industry growth flattens.
Industries vary on how the s curve manifests itself. Think for a moment about how various industries followed – or are following – the s curve. The length of time can be long or short, and the steepness of the s curve more or less vertical. Many industries disappear entirely (ie. the wagon wheel industry) while others maintain long term stability (ie. the rubber industry).
One very stable industry is banking. Banking largely has followed the s curve over centuries! Some think there is a possibility that banking is finally being disrupted as currencies may shift toward digital with the growth of crytocurrencies.
Many industries are stable for a time, and slowly give way to rising new industries. One example is the steel industry, which followed the s curve for many years and is still important but has declined due to advancing technology that either required less steel or enabled substitutes.
I’ll save much more that could be said about industry development for another post. Let’s move to the s curve and company strategy.
The S Curve and Strategy
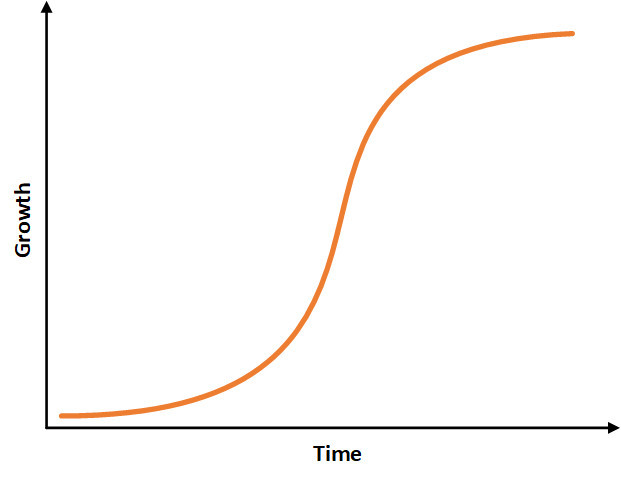
Just as a project slowly ramps up, accelerates, and then ramps down, a sound strategy will also consider how these natural forces will unfold when devising a strategy.
With any strategic endeavor, whether it is developing and commercializing a product, shaping and refining a specialized process, architecting and implementing a new business model, or building a valuable brand, the s curve will figure in the concept.
The s curve can stimulate many questions, such as:
- Does a market and industry currently exist?
- How much will it cost to get through the flat, initial stage?
- How can we emerge a leader going into the growth phase in the steep part of the s curve?
- How steep will the curve rise? How much growth is possible?
- Is it possible for my company to build competitive barriers in the initial and growth phases?
- How long will the industry and market last?
- How can we set ourselves up to transition from the current market to a new market when the market begins to decline?
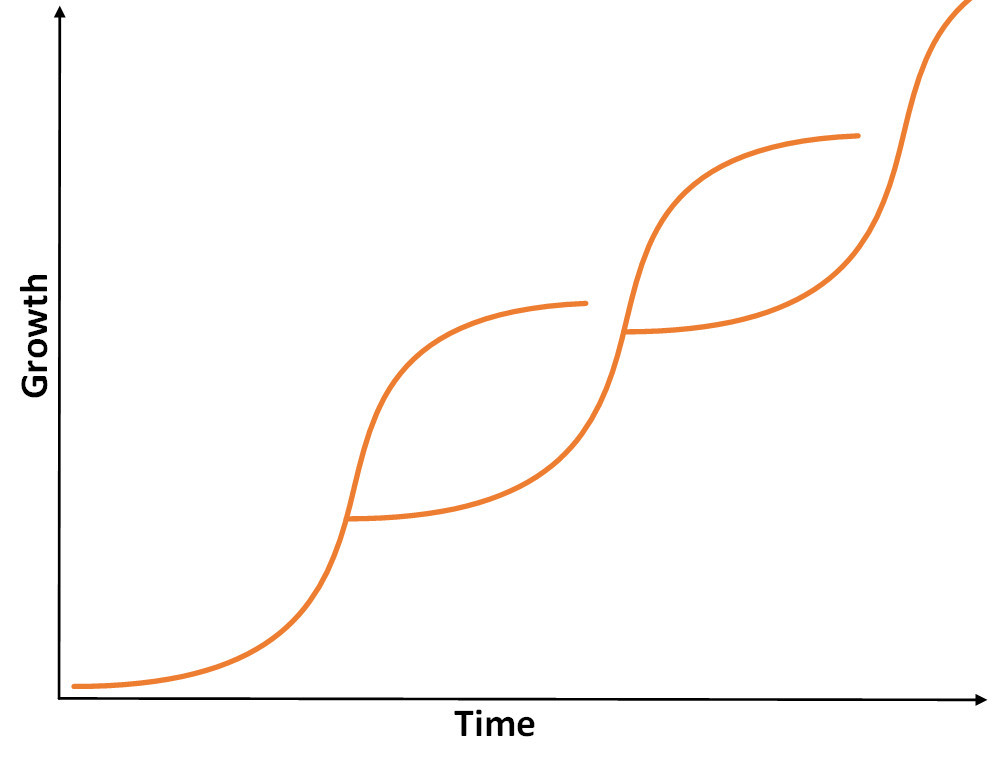
Regarding the last question, the biggest ‘trick’ when thinking about the s curve and strategy is the idea of jumping from s curve to s curve. This means that, as a growth phase is ending and you are moving to the flattened portion of the s curve, you introduce new offerings that add new s curves to the old, creating a more continual growth pattern.
Jumping from s curve to s curve in this manner is stimulated by innovation or invention, which starts the first new s curve. The old s curve stays in place, and the situation needs to be managed to allow that to happen profitably. The fresh development represented by the new s curve provides emerging growth just when the existing s curve begins to show deceleration.
Proctor & Gamble is an example of a well-run company that leverages this phenomenon, introducing new products when the curve for an existing product flattens. In this way it is able to maintain as much growth as the market can support, defend itself from competition, maintain high market share, and make the most out of an optimized combination of declining and growing product offerings.
Using the s curve provides important input to plan for obsolescence and replacement. It accepts the inevitable and takes action to create a positive outcome.
The S Curve and Project Portfolio Management
 Project Portfolio Management (PPM) is a complex activity that needs to take many things into consideration. One of these is considering project life cycles while making project investment choices.
The s curve diagram at right shows cost on the vertical axis against time on the horizontal axis. The idea here is to consider the balance of costs across all projects. If all projects are in the steepest stage of the curve, there would be an overall spike in costs – probably undesirable – across all projects during a period. Good PPM practices can consider this using the s curve and work to balance costs more smoothly as desired over time.
There are additional complexities, not shown in the diagram, such as variability in project life cycle. This means that every project, depicted by an s curve, would be shorter or longer in terms of time. Each project would also have a different total cost. Plotting these together across the s curve graph can provide a framework for balancing costs over time across the portfolio of projects that vary in time and cost.
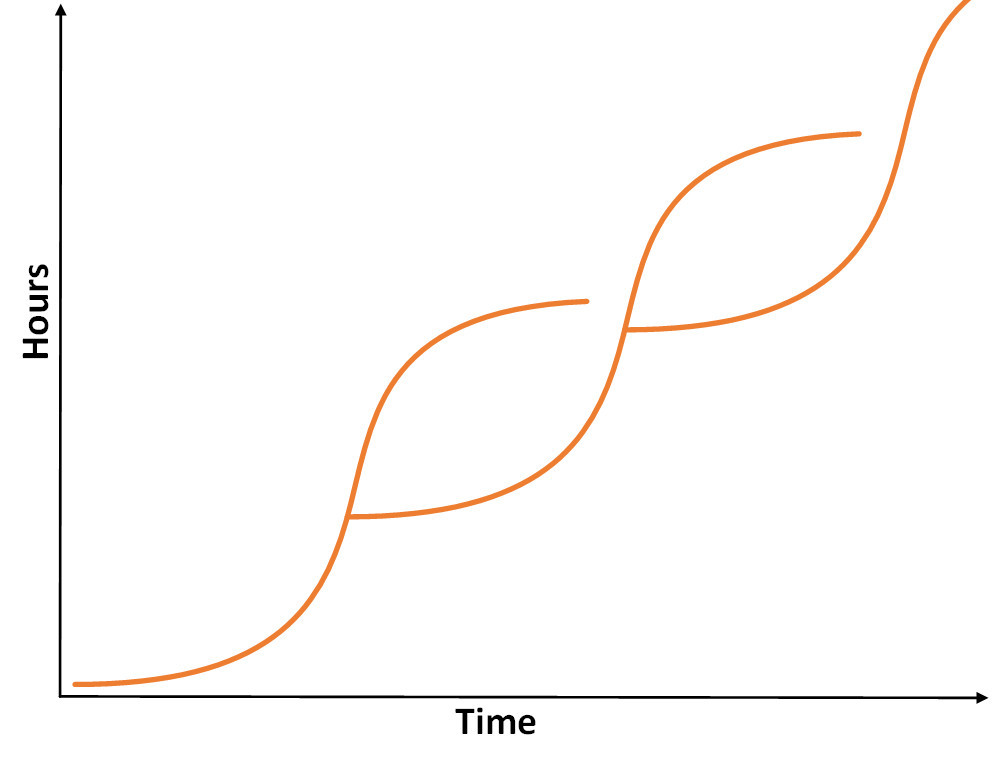 In similar fashion, project portfolio managers are challenged with balancing resources across all projects. The graph at right shows the same plot as above, but showing hours on the vertical axis against time on the horizontal axis.
The PPM challenge in this case is to balance resources – person hours – across many projects. Depending upon the urgency of the project, work loads can be balanced over time by shifting the timing of projects, or the supplemental resources can be obtained from contractors or through outsourcing to handle the additional project work load in peak times.
The s curve provides a good conceptual framework for planning that is based in the reality that projects will unfold in a natural, nonlinear pattern.
—————————————-
I recommend these PM templates (paid link):
—————————————-
S Curve Summary
The s curve is a natural phenomenon that applies well to both project management and strategy development. It has implications not only for planning but for tracking progress toward project or strategic goals.
Project managers who are familiar with the s curve concept as it is applied to projects can easily find the parallels in strategy development. Using the S curve in project management can help bridge the gap between implementation and strategy and improve the tie between managing the project and achieving the project’s strategic objectives. Finally, it can help with resource and cost planning in project portfolio management.
—————————————-
I recommend these strategy resources (paid link):
—————————————-
