Cost Structure is the final component step to completing the business model canvas.
This post provides an overview of the importance of Cost Structure as a canvas component, gives guidance on how to approach identifying the Cost Structure for a business, looks at different types of Cost Structures, and looks at the implications of Cost Structure considerations for strategy and project management.
What Is Cost Structure in the Business Model Canvas?
 Cost Structure is the last block of the business model canvas. It includes the identification of all costs required in order to execute the business model. Primary costs are driven by the Key Activities and Key Resources blocks, and there are also costs inherent in the Partners block.
The Business Model Framework is largely credited to Alexander Osterwalder and Strategyzer. To supercharge your understanding of business models, I recommend his book, “Business Model Generation: A Handbook for Visionaries, Game Changers, and Challengers”.
Cost Structure completes the Execution side of the business model canvas, and in fact is the last block on the whole business model canvas. Revenue Stream(s) completed the Value Creation side of the business model canvas. Together, they provide the foundation for the financial plan for the business – based on the following simple equation:
REVENUE – COST = PROFIT
Once the business model canvas for a business is completed by finishing the Cost Structure, you are ready to develop a complete financial model and financial projections for the business.
Categories of Costs
There are different categories, or types, of costs. It is important to understand the differences because they can influence strategic choices.
There are many types of cost curves, and this post is not intended cover them all! The image at the right is for illustrative purposes of the concepts of the three different types of costs described.
A list of costs in an income statement contains some costs that are variable, some that are fixed, and some that are in between – semi-variable and semi-fixed at the same time. Here is some more detail about these different categories of cost.
- Fixed costs – Represented by the blue line, this cost is of fixed amount in that it does not vary with quality produced. It is like the cost of getting started or cost of entry. An example is property taxes on a production facility. That cost does not vary with quantity produced – at least for that one facility.
- Variable costs – These costs, represented by the green line, increase somewhat proportionately (usually not exactly linear as shown) to the quantity produced. In practice, portions of the line will usually vary in slope as there are economies or diseconomies at higher or lower quantities. An example of a variable cost is the cost of wheels on a model fire engine. The cost increases incrementally for each additional model fire engine that is produced.
- Semi-variable/semi-fixed – Shown by the step pattern in red, these costs remain fixed for limited quantities and then step up. For example, some labor costs fit this pattern. It may require one employee to make 50 widgets, but you need to hire another to make 51 or more, another to make 101 or more, etc.
The type of cost is a key consideration impacting strategy because it can be a big influence on the competitive advantage that can be achieved.
Factors that Influence Cost Structure
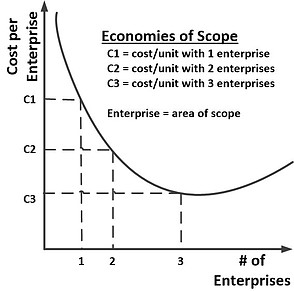 The type of cost helps determine potential economies that a business can achieve as it tries to optimize its cost structure.
The following are the typical types of economies that can be achieved:
- Economies of scale – This occurs when the cost per unit decreases with increasing quantities. Usually it is due to a single dimension focus on a single product line. For example, substantial fixed costs result in decreasing cost per unit produced as volume increases. Similarly, volume discounts are a form of economies of scale, where the cost per unit decreases as the quantity ordered increases. Economies of scale are hard to achieve in situations where most of the costs are variable.
- Economies of scope – As the name implies, this results from the business broadening its scope. Economies are realized from broadening focus into multiple areas to gain economies. For example, a business might add additional products in order to gain production efficiencies resulting from higher volume of certain parts. In addition, sales people may be able to provide a broader set of products to customers with whom they are already engaged, thus decreasing the cost of selling each unit.
Economies of scale and economies of scope work together. Often economies of scope enable specific economies of scale
The potential for economies is important for identifying the target Cost Structure for the business.
Strategy and Cost Structure in the Business Model Canvas
 Strategy and Cost Structure are closely intertwined, as indicated by these strategic questions:
- “Should we focus on vertical integration?”
- “What value chain economies can we achieve?”
- “Should we differentiate?”
All of these questions at least partially involve the Cost Structure.
Whether you want to think in terms of Porter’s three generic strategies – see illustration at right – or any other framework such as the Ansoff Matrix Model, Comparative and Absolute Advantage, Value Chain Advantage, of the BCG Advantage Matrix, it comes down to two approaches to strategy:
- Cost driven approach – This approach uses the Cost Structure as a strategic advantage. It is driven by the Execution side of the business model canvas – Key Activities, Key Resources, and Key Partners. It configures these in such a way as to achieve a cost driven strategic advantage – lower cost and lower price.
- Value driven approach – This approach is less focused on the Cost Structure and more focused on Value Creation – the right side of the business model canvas. The focus is more on building strategic advantage through judicious choice of Customer Segments, careful shaping of Customer Relationships, and building value-added communication and distribution Channels. It configures these such as to achieve a differentiation advantage, which enables higher pricing.
The quad chart above, from Porter’s three generic strategies, shows that the Cost Structure can be developed based on these two approaches.
It can be derived from a Cost point of view on the left side of the diagram – where Cost is the source of competitive advantage. Or it can be derived from a Differentiation perspective – where Differentiation is the source of competitive advantage.
The Cost Structure needs to be derived by one or the other to complete the business model canvas.
—————————————-
I recommend these strategy resources on FlevyPro (paid links):
| Business Model Canvas 140-slide PowerPoint deck and supporting PDF  |
| Business Model Canvas 22-slide PowerPoint deck  |
| Business Model Canvas: Guide, Process and Tools 43-slide PowerPoint deck  |
| Business Model Canvas – Implementation Toolkit Excel workbook and supporting ZIP  |
—————————————-
Project Management and Organizational Cost Structure
In his discussion of strategy and project management at the PMO Symposium by the Project Management Institute (PMI), Michael Porter outlines two types of projects:
- Operational effectiveness – These projects are all about implementing best practices. Many systems projects, such as sales force automation, enterprise resource planning (ERP), or even project management applications all fit into this category. They provide and enforce best practices, creating efficiencies and driving costs lower within the Cost Structure.
- Choosing things differently – Projects that evolve from this thinking involve key questions about which customers to serve, which specific customer needs you are trying to meet, and the pricing you want to achieve. Rather than best practices, these types of projects support a focus on differentiation into more blue ocean competitive environments.
Porter contends that a business will never really achieve competitive advantage with operational effectiveness projects. It will ‘keep up’ by implementing best practices and thus will merely stay in the game. I would argue, however, that many of these types of projects can provide competitive advantage from a Cost point of view. They support a cost-driven strategy.
—————————————-
I recommend these PM templates (paid link):
—————————————-
‘Choosing things differently’, by contrast, produces a differentiation advantage which enables higher pricing. It results in a completely different Cost Structure.
Cost Structure decisions, therefore, are important drivers of projects. Project portfolio decisions derive directly from Cost Structure considerations. The important thing for project managers is to understand the drivers behind their projects – operations effectiveness or differentiation – and to assemble the portfolio and execute the projects to achieve those clear objectives.

You can quickly and conveniently work through the Cost Structure and other components of the Business Model Canvas with the Lucidchart Business Model Canvas template (Try for free) – recommended!
Conclusion and Further Resources
This post has provided an overview of the importance of Cost Structure as a component of the business model canvas, guidance on how to approach identifying the Cost Structure for a business, looked at different types of Cost Structures, and looked at the implications of Cost Structure for strategy and project management.
Completing the Cost Structure – and the whole business model canvas – positions you to develop a full financial model for the business.
How have business Cost Structure choices impacted your projects?
To supercharge your understanding of business models, I recommend “Business Model Generation: A Handbook for Visionaries, Game Changers, and Challengers” by Alexander Osterwalder.
For an overview, I recommend the following video, “Business Model Canvas Cost Structure”, by Steve Morris of StartupSOS.