The Advantage Matrix is an old Boston Consulting Group classic strategic framework. Despite changes in industry structure, the competitive environment, and the impact of technology since it was originally conceived, it still has applicability as a framework and as a thought tool.
History and Basics of the BCG Advantage Matrix
 The BCG Advantage Matrix, also sometimes known as the Competitive Advantage Matrix, is a decades old but still relevant strategic framework developed by Boston Consulting Group (BCG). It has similarities and overlaps to some other older BCG frameworks such as the Growth Share Matrix, Experience Curve, and the Rule of Three and Four.
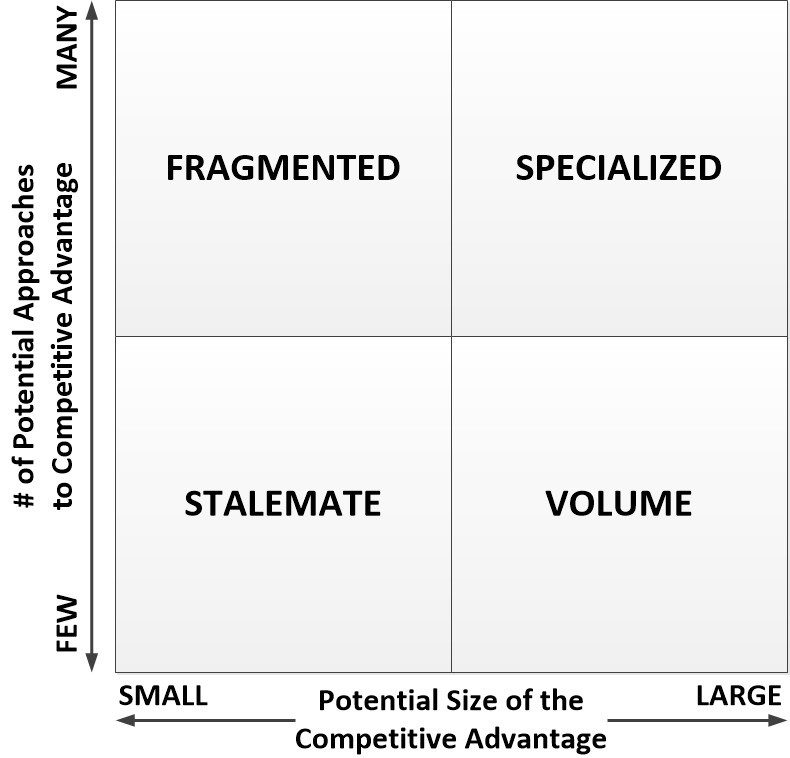
The matrix, shown at right, provides a visual along two dimensions:
- The number of different approaches available to gain competitive advantage
- The potential size, or impact, of any particular competitive advantage
Understanding where the competitive environment is along those two dimensions can provide an organization with some realistic insights to guide the development of strategy. The matrix shows, in essence, the type of strategy that must be considered for optimal opportunity in the given environment, as defined by those dimensions.
The Four Quadrants of the BCG Advantage Matrix
The following describe each of the four quadrants of the BCG Advantage Matrix:
- Stalemate Industries – The ability to gain competitive advantage is limited. On the vertical axis of the chart, there are a limited number of ways to differentiate from the competition. In addition, the potential size or impact of a competitive advantage illustrated on the horizontal axis is small. Profiting in Stalemate Industries is very difficult.
- Volume Industries – There is limited opportunity to differentiate, but the impact of any differentiation on sales is substantial. That high potential impact means there is an opportunity to profit from economies of scale. On the chart’s vertical axis, there are a limited number of ways to differentiate, but the potential size of the impact on the horizontal axis is large.
- Fragmented Industries – Here the ability to differentiate is substantial, but the impact of any advantage is limited. On the vertical axis, the number of ways to differentiate is large. However, the potential size of the competitive advantage is small. There is profit potential if the organization can be a leader in differentiated, value added products and services.
- Specialized Industries – The ability to differentiate is high, and the impact of the competitive advantage is large. There is high profit potential, if the company can rapidly get up the learning curve and has the resources to grow to scale. On the vertical axis, there are many ways to differentiate, and the potential of the advantage, as depicted on the horizontal axis, is large.
The twist is that these quadrants apply most directly to relatively stable industries, or to industries that are moving toward stability.
Strategic Application of the BCG Advantage Matrix
Competitive advantage within the framework of the BCG Advantage Matrix is, at least in part, based on economies of scale – driven by so called ‘supply-side economies of scale’. The term refers to the idea that economies of scale are gained by increasing volume, which means being a large supplier. Typically, these supply side economies of scale are maximized well before the entire market demand is satisfied, so competitors are able to avoid becoming a natural monopoly.
Beyond economies of scale, the quadrants of the BCG Advantage Matrix tend to call clearly for stable industry conditions. While stability is not ubiquitous today, it is certainly still present. Hence, the model retains value, even if for shorter time frames, and is worthy of consideration.
Where stability is not the rule, the immediate alternative is to take ‘adaptive approaches’. For example, consider when an industry is rapidly changing and evolving, seemingly not based on the product life cycle. In those situations, the following ideas can help identify the appropriate ‘adaptive’ approach:
- Strategy Framework Canvas – Consider the relevant drivers to identify the right strategic framework.
- Strategic Agility – Accept the changing environment, and think about the best approaches to being adaptive.
- Economies of Scope – Discover possible synergies among different parts of the business – including platform base.
- Ansoff Matrix Model – Visualize tried and true strategic options such as market penetration/development, product development, or diversification.
- Dynamic Capabilities – Build a whole new competency within the organization based on adaptability.
- Blue Ocean Approach – Identify uncontested marketplaces, even if very temporary, and build a leadership position.
- Lean Innovation – Build adaptive processes to learn and build business around the hotpots for customers and markets.
- Design Thinking – Deliver what customers want, not what demographics show.
It goes further, however, than just adaptive approaches. It goes deeply into the growth of network effects, the driver behind the biggest growth companies today, such as Facebook, Amazon, Apple, Netscape, and Google (FAANG). These companies have ‘demand-side economies of scale’, where the value for each customer increases with each additional customer, developer, partner, or any other network member that is added. And this happens across segments of the business, seemingly with no limit.
Indeed, the movement from old industry leaders to new industry leaders, and a new way of competing and winning big, is highlighted in the Wall Street Journal (WSJ) article, “Move Over, GE. The Tech Conglomerates Are the New Leaders of Industry” by Christopher Mims. The article summarizes the new advantages nicely:
“Modern platform companies take advantage of something unique to the internet age. That something is “demand-side economies of scale,” which arise because platform companies are taking advantage of network effects…”
Impacts of the BCG Advantage Matrix in Project Management
—————————————-
I recommend these PM templates (paid link):
—————————————-
Here are some areas where I think the BCG Advantage Matrix applies for PM’s:
- Risk management – Knowing what type of industry environment you are operating in can help you focus on projects driven by strategies and tactics that are compatible with the environment. It’s like an organization playing to its strengths – sticking to something that is in sync with the natural structure of the industry competitive environment.
- Size of projects – Projects in a stable, well understood environment can be larger, because they are less subject to change. By contrast, when the environment requires more of an adaptive strategic approach, projects may need to be broken into parts which include learning, discovery, and experimentation.
- Project success metrics – The metrics of projects that fit the BCG Advantage Matrix need to be aligned to the particular quadrant of interest. For example, if the Quadrant that applies is Volume, then projects should be measured by metrics that help grow volume. If the Quadrant is Fragmented, the focus should be on metrics to achieve high differentiation for the most impact possible.
- Speed and duration of projects – Similar to the size of projects, the speed and duration will change depending on the type of environment. In a stable environment where the BCG Advantage Matrix most closely applies, projects can typically be executed more slowly and last for a longer duration because the pace of change is not so intense. In environments requiring a more adaptive approach, the rapid pace of change requires speedier execution and shorter duration projects.
It always helps project managers to have a clear frame of reference on anything strategic, and the BCG Advantage Matrix can help.
Further Resources
The following are short original articles from Boston Consulting Group (BCG):
The Experience Curve, by Bruce Henderson, 1968.
BCG Classics Revisited: The Experience Curve, 2013.
The Rule of Three and Four, by Bruce Henderson, 1976.
BCG Classics Revisited: The Rule of Three and Four, 2012.
What Is the Growth Share Matrix?, by Bruce Henderson, 1968.
BCG Classics Revisited: The Growth Share Matrix, 2014.
The following are related resources (these are paid links):


