This post examines the Boston Consulting Group Growth Share Matrix – developed by Bruce Henderson of the Boston Consulting Group (BCG) back in the early 1970s – and how it might relate to your projects. As the name implies, the Growth Share Matrix allows you to visualize a product or service business related to the growth characteristics of the market and the market share related to competitors.
The framework is very business/product/service oriented, so if your project is in a business that fits that broad profile, or an organization that deals with businesses that fit, this post will be of interest to you.
While the BCG Growth Share Matrix framework was developed decades ago, it still remains relevant today. Let’s begin examining why it is relevant, and how it can help you manage your projects more effectively.
Overview of the BCG Growth Share Matrix Diagram
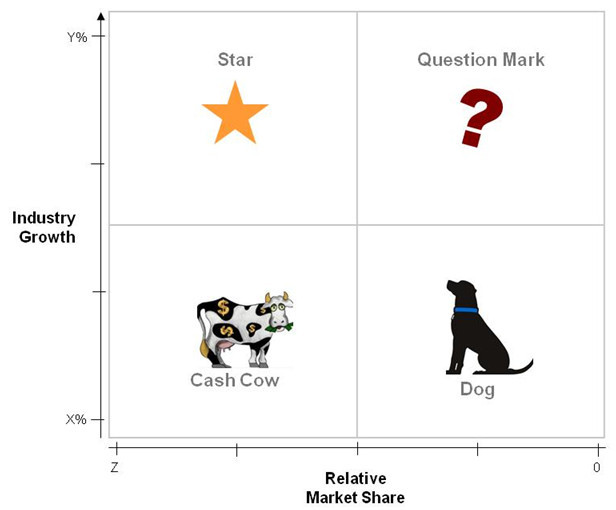
The BCG Growth Share Matrix diagram consists of four quadrants with vertical and horizontal axes. The Vertical axis reflects Industry Growth metrics – from low at the bottom to high at the top. The horizontal axis shows Market Share relative to the industry leader – from high on the left to low on the right.
Industry Growth provides a metric that reflects industry attractiveness, while Relative Market share reflects competitive advantage. In short, the diagram shows:
- The upper left quadrant, the Star, sits at the intersection of high Industry Growth and high Relative Market Share.
- The Question Mark – upper right quadrant – sits where high Industry Growth and low Relative Market Share intersect.
- At lower left, the Cash Cow is at the intersection of low Industry Growth and high Relative Market Share.
- The Dog, at lower right, sits at the intersection of low Industry Growth and low Relative Market Share.
The idea is to place a particular business – the business your projects or programs are supporting – into one of these quadrants based upon Industry Growth and Relative Market Share. The strategic posture of the business is reflected not only by the quadrant, but where in the quadrant it sits.
The positions within the matrix diagram and the dynamics around the business closely parallel the life cycle stages of business development.
Let’s take a closer look at the characteristics of each of the quadrants.
The Star Quadrant
 Stars are high potential businesses – with a high market share in a fast-growing industry. The business likely is generating a lot of cash because of its strong market share, but also has high cash needs to support growth.
The goal is for Stars to become the next Cash Cows, where slowing industry growth coupled with a strong market positions and competitive barriers brings continuing high cash inflows and a decrease in cash demands.
The payoff potential is that the cash investment in a Stare business will build and sustain the business’ market leadership position. If it does not, it will transition to the Dog quadrant.
The Question Mark Quadrant
 Question Marks are businesses in rapidly growing markets. They have low market shares and generate limited cash, but have high cash demands to keep up with industry growth, resulting in a large net cash outflow.
A Question Mark business is therefore sometimes referred to as a “problem child”.
A Question Mark has the potential to gain market share and move to the Star quadrant, and eventually the Cash Cow quadrant when the market growth slows. However, if the Question Mark business fails to become a market leader, it faces the prospect of shifting to the Dog quadrant when market growth declines – and after a lengthy period of cash outflows.
Question Marks, thus, are high risk. The probability and impact of success or failure must be analyzed carefully to support a sound investment decision and risk management approach.
The Cash Cow Quadrant
As a leader in a mature market, a Cash Cow generates substantial cash inflow without the cash outflow that would otherwise be required to support high growth.
The moniker ‘Cash Cow’ signifies that such a business should be “milked” for the excess profits it generates – and with as minimal cash investment as possible.
Cash Cows can provide the cash required for other investment. For example, it can be used to help fund a program to transition a Question Mark to the Star and later Cash Cow quadrants – with careful analysis on the probability and impact of becoming, or failing to become, a market leader.
Many organizations in essence manage a portfolio of businesses. Using a business portfolio approach, Cash Cows can cover administrative costs across the organization, fund research and development, help pay off loans and other liabilities, and pay dividends. The stable cash flow of a Cash Cow also provides a sound basis for evaluating the value of the business.
The Dog Quadrant
Dog businesses have low market share, and thus a poor competitive position, in a low growth market. They may not consume a lot of cash, but they also do not generate much cash.
Dog businesses, however, still require organizational capital to be maintained, but with little potential for a good return. Since the capital could be redeployed and better invested – for example in Question Mark, Star, or Cash Cow businesses – Dog businesses are candidates for divestiture or liquidation.
In short, Dogs are to be avoided and only provide value to the organization when converted to cash.
Project Management Implications of the Growth Share Matrix
So, what does all of this mean to you as a project, program, or portfolio manager?
—————————————-
I recommend these PM templates (paid link):
—————————————-
Project manager
It is extremely valuable for making decisions to understand how your project fits into the whole strategy for a company’s business. Where it fits is, in large part, informed by where that business sits on the Growth Share Matrix.
Making use of the Growth Share Matrix framework, whether you receive it formally or your team and stakeholders create it ad hoc, will inform your thinking and planning of schedule, impending risks, and objectives and key measurable results to be achieved by the project.
Program manager
Your responsibilities in program management are even more strategic in nature. You will be informed by the same things mentioned above for the project manager, but you will be more intimately involved and probably responsible for one or more key outcomes related to the organization’s strategy.
For example, you may be responsible for a program to scale some aspect of production of the product or service. Your progress metrics will need to closely reflect the needs of the business, as informed by its characterization as a Question Mark, Star, or Cash Cow.
In addition, it will be helpful for you to think not only about the quadrant that the business currently occupies, but the target quadrant. Your program, for example, may have as primary objective to move the business from Question Mark to Star or Cash Cow. Positions in the Growth Shar Matrix are not static!
Portfolio manager
In the portfolio management function, it will be helpful to understand the company’s portfolio of businesses, which can be aided by understanding where each business falls in the Growth Share Matrix.
As the company seeks to balance its portfolio of businesses, you will also need to achieve a balanced portfolio of projects based upon cash needed and potential cash generated across the portfolio of businesses. It will also be critical to weigh the risks of various courses of action, especially for Question Mark businesses.
Conclusion
As with all frameworks discussed in this blog, the BCG Growth Share Matrix diagram provides a good visual reference for making decisions and implementing solutions in a coordinated way across the organization. Frameworks like this help you to understand, communicate to stakeholders, and execute with greater clarity of objectives and alignment with strategy.
—————————————-
I recommend these strategy resources (paid link):
—————————————-


